Solar in winter months?

Om my Hymer S700 I had 240w of Solar and 3 x 110Ah Batteries. In Spain from just before Christmas to mid February I had to look as a way of topping up. We had lights and TV everything else was on gas.. I had B2B and a Gasparini 12v 20 amp generator, but found it easier to find a camper stop with EHU for a night one night per week This offered the chance to top up drinking water, get rid of waste and visit the shops. With the B2B we could charge where we were if needed, the same went for the generator, However we chose our stops for the solitude and quiet so we were not inclined to spoil this with the engines running. We were fine on solar and moving about for the rest of the year where ever we were.
Sanity at last to this thread! Lol
 
Yes I think a lot will depend where you are intending being in low sun months. I would probably be okay in Spain or Portugal.
 
Based on real world experience, and paranoia invoked by this thread. I decided the Betty Build will need more solar. I thought 480 watts would be enough. After lots of hunting I managed to find two 100watt panels to fit in the only spare roof space. Next problem is to find some high temperature double sided adhesive foam sheet to bond them.IMG_0192[1].JPG
 
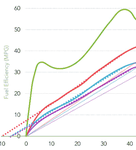
OK, seeing as you went to the trouble of drawing a line, I've done one that shows what I mean.

mpg.png
I've ignored the green line, because we agree it's a red herring.

The thick dashed lines are a straight regression line drawn back to the axis.

Personally, I think these lines match the curves very well.

The thin dashed lines are the same line, but transposed across until it meets the origin.
 
OK, seeing as you went to the trouble of drawing a line, I've done one that shows what I mean.

View attachment 56066
I've ignored the green line, because we agree it's a red herring.

The thick dashed lines are a straight regression line drawn back to the axis.

Personally, I think these lines match the curves very well.

The thin dashed lines are the same line, but transposed across until it meets the origin.

Red for example. How can you have (approx) 8mpg, at 0 mph?

And edit,
The thin dashed lines are the same line, but transposed across until it meets the origin.

What for?
 
Last edited:
I'm sorry. You are going to have to find someone with more patience than I have to explain it to you.
 
I'm sorry. You are going to have to find someone with more patience than I have to explain it to you.

Come on, we've gone this far. Otherwise it's going to seem like you can't ;) lol.

Just to make sure we're on the same page, what are you trying to prove by adding the line on the graph?
 
You're right: I don't think I could get you to understand. You'd need a fair bit more maths as a precursor.
I had to think about it, despite good qualifications in maths and physics.
 
I had to think about it, despite good qualifications in maths and physics.

A levels in both, grade B. A bit more recently that you I suspect. Again, Just to make sure we're on the same page, what are you trying to prove by adding the line on the graph?
 
I'd have expected you to grasp it, then. Perhaps you forgot what you learned.
 
I'd have expected you to grasp it, then. Perhaps you forgot what you learned.

You've made so many claims on this thread, I've lost what you're trying to prove.

Again, Just to make sure we're on the same page, what are you trying to prove by adding the line on the graph?
 
The discussion was about how much fuel a motorhome with a diesel engine used when idling. You (I think it was you) introduced this graph (of petrol engines vehicles) presumably as information about that.
Ideally, the graph would show gallons per hour at different speeds, but they're not easy to find.
You could build such a graph, but going from a graph of unknown provenance and limited relevance is not a good plan.
I am not prepared to waste any more of my time with it.

I see. You certainly could build a graph of GPH against MPH.

Each point on the graph where x = MPH and y = MPG is defined as

xM/H = yM/G

Rearranging, to get rid of M you get

G/H = x/y

Example point at 40 MPH, where it's 40MPG, you get 1 GPH. Which is obviously right.
At 10MPH it's about 15MPG, it's 0.66 GPH again, right.
80MPH, 30MPG = 2.29 GPH

Could you do me a favour and plug 0mph into the formula?

The graph could be any shape you like, for any engine in the world, running on any fuel. If it's MPH vs MPG, you cannot calculate GPH at 0MPH, idling.
 
Above 40mph, the graph is non-linear, and it is pointless to even look at it. That much is obvious to anyone.

Below that speed, it is pretty straightforward.

As I said, I've not got the patience to try to explain it to you.

Work it out for yourself, get someone else to explain it, or remain uninformed.

Your choice.

It doesn't matter if it's linear or not. You simply cannot use a MPH/MPG graph to calculate GPH at zero MPH.

If you can't explain to me how you can, I'll understand that to mean you agree with my statement.
 
I have told you I'm not going to bother to explain it to you. But I'll give you a clue.
The linear part of those graphs can be represented as a simple formula with a constant to give the offset from zero.
Think about it.
 
I have told you I'm not going to bother to explain it to you. But I'll give you a clue.
The linear part of those graphs can be represented as a simple formula with a constant to give the offset from zero.
Think about it.

Sure it can, but as we have actual data at the bottom of the curve that would be incorrect.
 

Users who viewed this discussion (Total:0)

Back
Top