For
non-Lithium batteries, it is generally understood and accepted that the higher a current you draw for a given
battery, the lower the available capacity is.
This is why you will usually see different capacities quoted e.g. For my Leoch Extreme AGMs, the C100 Capacity is 110Ah, but the C20 Capacity is 95Ah (C100 means the
battery will be fully discharged in 100 Hour at a constant current - that current being 1.1A (1.1A x 100Hrs = 110Ah), but 95Ah if fully discharged in 20 hours - so a current of 4.75A (4.75A x 20Hrs = 95Ah). And if you discharge at higher rates the capacity reduction continues (some
battery info includes capacity values for C10, C5 and even C2).
This 'effect' is first noted by a scientist called Wilhelm Peukert over 100 years ago. A starting point to read more about this could be seen here -
https://en.wikipedia.org/wiki/Peukert's_law
When setting up a monitor like a
Victron BMV, you have a entry setting to enter a Peukert Factor to accurately calculate the
Battery SOC (State of Charge) to recognise the reduced capacity encountered when drawing a high current.
Now I have been doing some testing of
battery capacities against usage to get a better practical understanding of Peukert's Law.
And what I am going to say will tend to go against the commonly understood principle of Peukert's Law and I am coming to the conclusion that it is not being understood and applied correctly in the SOC algorithms. And the following is the reason ...
So my
Battery Bank is 4 x Leoch Extreme AGM Batteries. Capacity at C100 is quoted as 110Ah each; at C20 they are 95Ah each. It is the C20 Rating that
Victron advise you to enter when setting up the monitor (so my
BMV-712 is setup with a
Battery Bank of 380Ah). I left the Peukert Factor as the default setting.
At a C100 Rating the
battery bank is nominally 5280Wh Capacity (4 x 110Ah x 12V) and at C20 it is 4560Wh.
I fully charged the
battery bank and then set the water heater on. When it is on, it draws around 190A through the
Inverter - that is equal to a nominal C2 rating on my
Battery Bank.
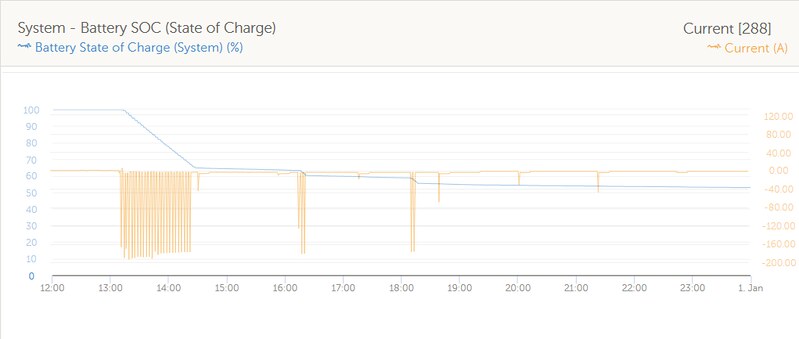
I have it setup to be a cycle of 1 minute on, 2 minutes off. This chart shows the on-off cycle and how the SOC is reducing as power is being drawn from the
battery.
Extreme SOC Drop by
David, on Flickr
The Heater was on for 1 hour - this works out to be a power usage of ~700W. The SOC has gone from 100% down to about 65%.
Doing the maths, drawing 700W in one with a 35%
battery capacity use means the
battery bank capacity would be just 2000W - or 167Ah! That is a massive drop and taken on face value would mean using a high power
inverter would be super-inefficient.
And now that high power draw has been removed, the
battery (on the C20 Setting the
BMV requests) the remaining capacity is 2964Wh (4560Wh*65%) giving a total capacity of 3664Wh rather than 4560Wh.
But is that right? where has the rest of the capacity (900Wh, or 75Ah) gone? that is a lot of power to just disappear in 1 hour isn't it?!
I don't actually think it is gone anywhere and the way Peukert's Law is applied in
Battery Monitors is flawed. You will see fom the chart above the heater came on for a couple more minutes twice more, plus there were other small general loads. So around lunchtime today when I looked at the
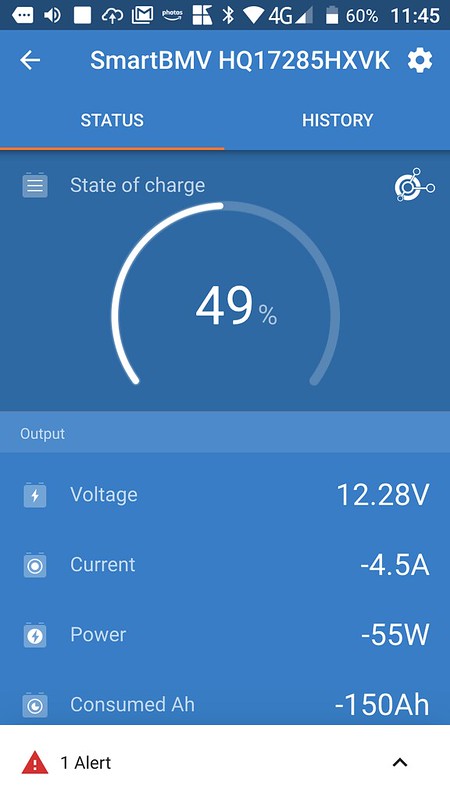
Battery Charge I got this from the
Victron Monitor:
Screenshot_20190101-114556 by
David, on Flickr
So I am below 50% and in the "danger" level!
I happen to have another SOC Monitor installed that I am testing. On this one I set the same Initial
Battery Bank size (380Ah) but there is no Peukert Factor applied in this monitor. This is what this other monitor is saying
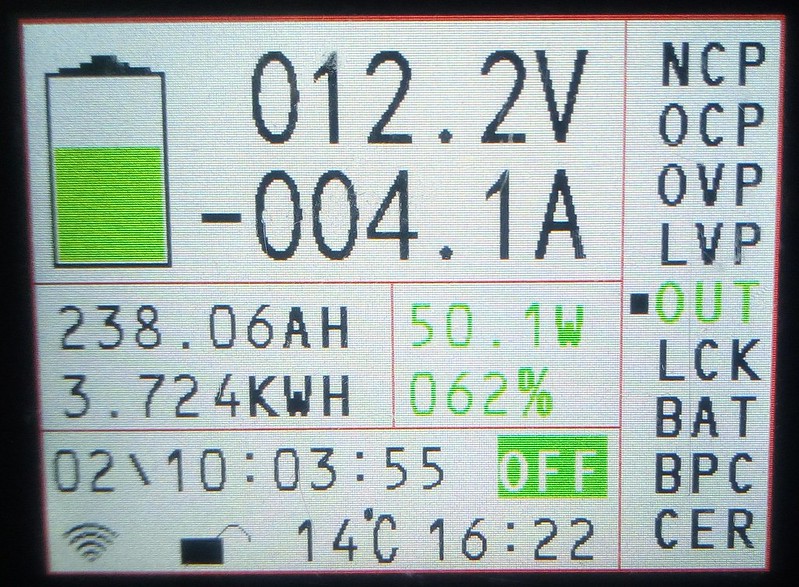
IMG_20190101_114514 by
David, on Flickr
The Monitor with the Peukert Factor is 49% and the one without is 62% - which is correct?
Well, we can use a fallback method to check .... As can be seen on the monitors, there is a current draw of 4.1-4.5A (depending on which monitor), and the voltage is sitting at 12.2-2.28V (again depending on Monitor).
Using a traditional
Battery State Chart (ideally when there is no load or charge on the
battery for a few hours) you can correlate the Voltage Reading to the Charge left.
There are a few variations on these, but they are all pretty similar. Below is an pretty good example.
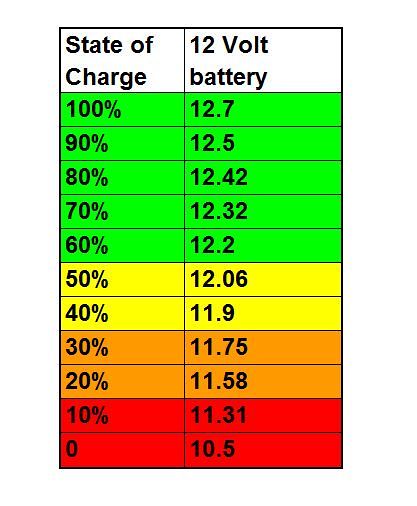
Battery Voltage Chart by
David, on Flickr
Using the Voltages shown in the monitors and applying them to this chart, the SOC is really between 60-65%, which makes a lot more sense then the 49% the
BMV tells us and the Monitor that ignores the Peukert effect would seem to be the most accurate!
There is a guy on Youtube that makes some good videos about Batteries and Inverters (he's a bit of a geek but for geeks like me, it is interesting anyway

) and he has similar thoughts about Peukert and has done some testing for his own curiosity.
I think I will be removing the Peukert Factor from my
BMV settings (or more precisely just making it 1.0) as - IMO - it is giving misleading information as regards the SOC, at least for my style of use that involves very short bursts of very high current. I will keep with the C20 Rated entry (380Ah) rather than the larger C100 (440Ah) value (the difference actually being more than the usuable capacity of an entire
battery!) as a conservative value and as my usual current draw is in the C20 range.
I would be interested in others opinions, thoughts and experiences (but based on practical data rather than just a link to a internet resource that just says "this is what it is" without providing empirical data).

